Using SAS for RSCH Courses
The purpose of this page is to help users understand the basics of using SAS. Please note that while this page will help get you started, it is important that you read all directions in the Canvas module items and course assignments.
The following RSCH courses use SAS Studio:
- RSCH 650
Be sure to also use the Additional Resources page of this guide to access more in-depth SAS training materials and how-to videos.
If you have any questions or concerns, visit the Support page of this guide
Using SAS Studio: Uploading an Excel Data Sheet
The area of this guide is to help you understand how to upload and save an Excel data file in SAS. Doing so will allow you to use the data for any SAS task within SAS Studio. These steps must be completed before your data is ready to use in SAS.
RSCH 650 requires you to perform a t-test with data loaded in SAS. Visit the Performing a t-Test with SAS Studio area of this guide to learn how .
Additionally, please refer to your course for any assignment specific directions.
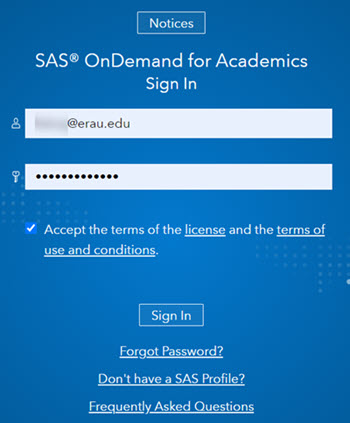
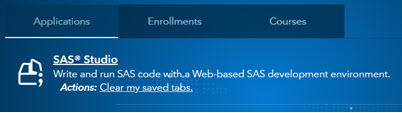
Step 2
Select SAS Studio from your SAS dashboard.
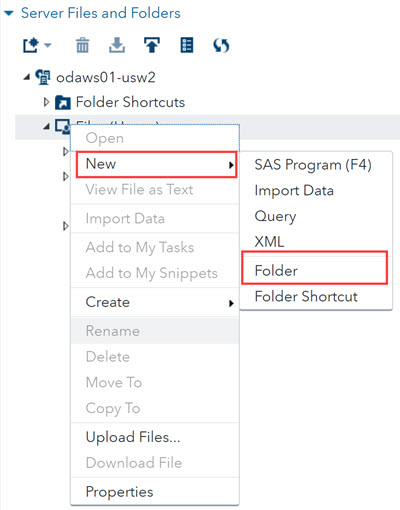
Step 3
Before you upload your Excel file, you'll need to create a folder and library to save your work. Otherwise, you will have to repeatedly upload data every time you open the SAS Studio Interface.
Right click on Files (Home) in the Server Files and Folders section. From the dropdown menu, select New > Folder. A dialog box will open.
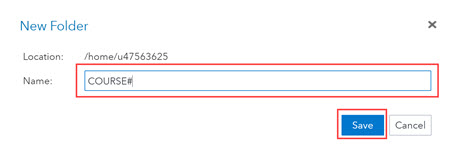
Step 4
Name the new folder with your COURSE NUMBER (i.e. RSCH 650). Select Save.
Step 5
The folder you made will appear under Files (Home). Right click the new folder; from the dropdown menu, select Create > Library. A dialog box will appear.
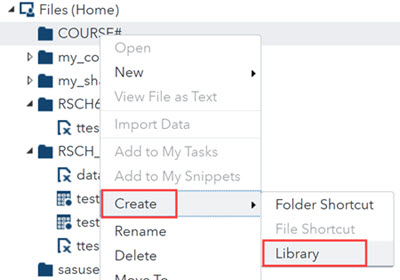
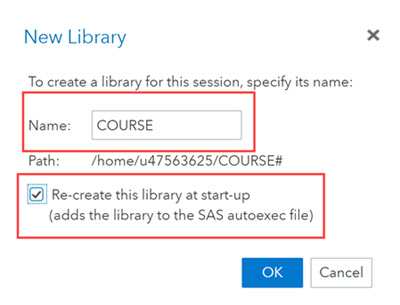
Step 6
Fill out the library information as follows:
- Name: Same name as the folder.
- Re-create this library at start-up: Make sure this is selected.
Step 7
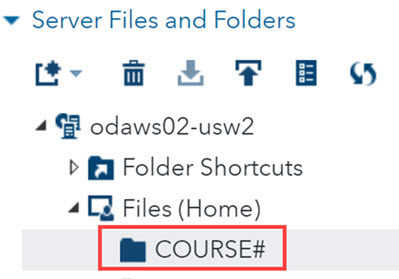
You now have your folder and library set up to be able to save your Excel file as a SAS file (.sas7bdat).
Select your COURSE# folder in the Server Files and Folders section. This will allow you to upload your Excel file into SAS.
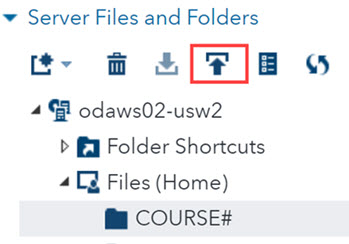
Step 8
Select the icon.
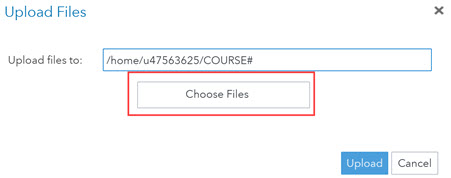
Step 9
The Upload files textbox shows you the path your document will be saved under.
Select Choose Files. This opens up your device's file explorer. Find and open the Excel file you want to upload.
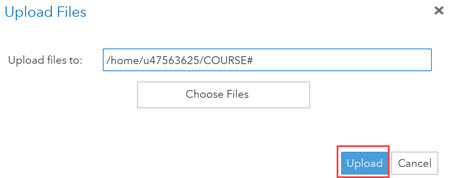
Step 10
Select Upload.
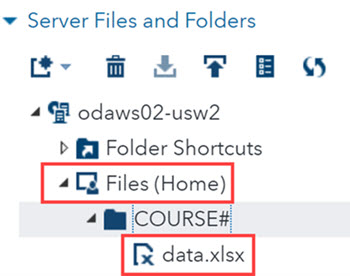
Step 11
Open the Files (Home) folder. The Excel file you uploaded will now be listed at the bottom. Double-click it to open it as a new tab in the SAS interface.
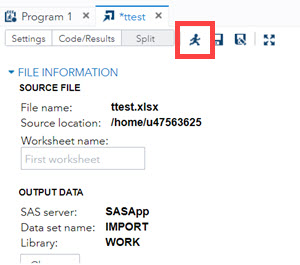
Step 12
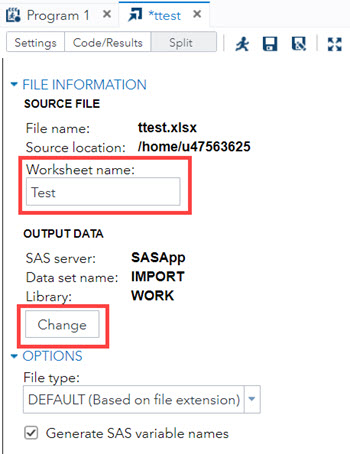
You'll see file information open on the right. Select the icon in the toolbar. This helps generate a table of the data in SAS.
Step 13
You need to now name the data worksheet you'll use in SAS. Type the name in the textbox and select Change. A dialog box with your SAS libraries will open.
Note: You may need to scroll down or expand the window to see the change button.
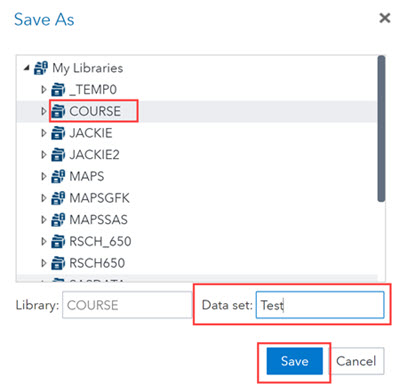
Step 14
Select the COURSE# library you created.
In the Data set textbox, type the worksheet name.
Then select Save.
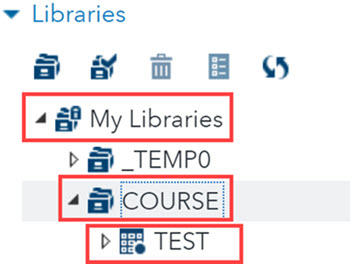
Step 15
Open the Libraries directory and open the COURSE# library.
Double-click the name of the .sas7bdat file you saved. This will open your data in the SAS interface.
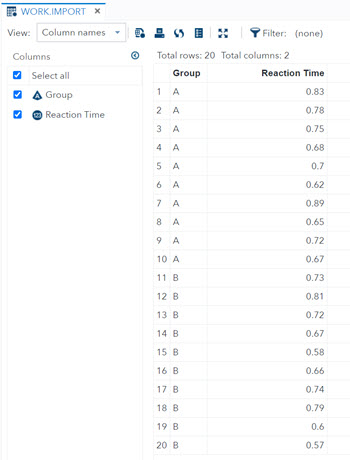
Step 16
You can now see your data organized in columns. You can use this data set to perform multiple tasks in SAS. Visit your course for specific information on the necessary tasks you need to complete.
You may want to visit the Additional Resources page for comprehensive SAS guides and video tutorials. This can help you in performing tasks within the SAS Studio interface.
Performing a t-Test with SAS Studio
You must complete the How to Use SAS Studio for RSCH 650 prior to completing the following steps.
Be sure you refer to your course for assignment specific information. The purpose of this area is to help you perform a t-test using SAS Studio.
Step 1
Be sure you are logged into SAS Studio. If you haven't already, open the Libraries directory and open the WORK folder.
Double-click IMPORT to open your data in the SAS interface.
Step 2
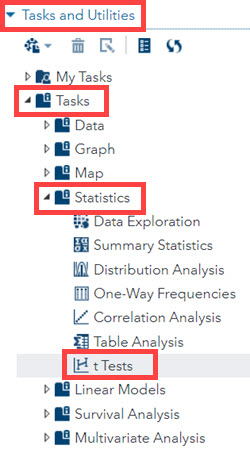
Your data should be open on the right area of the SAS interface. To perform a task, go to the Tasks and Utilities section.
Open Tasks > Statistics. Double-click t Test to open the statistics task interface.
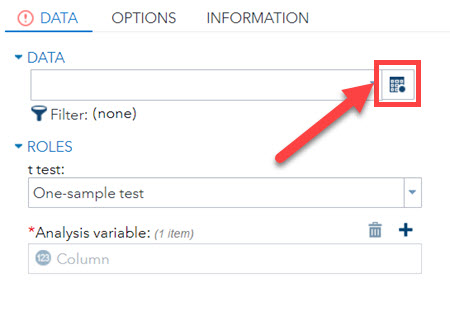
Step 3
You need to load your data into the t-Test interface. Select the icon to open your SAS libraries.
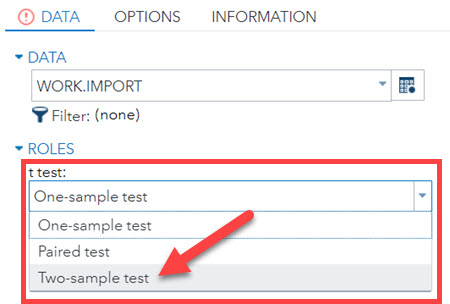
Step 4
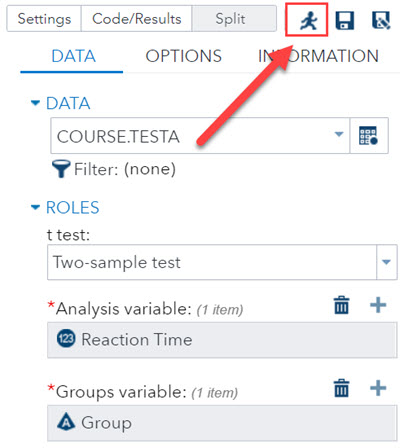
Under Roles > t test, choose Two-sample test from the dropdown.
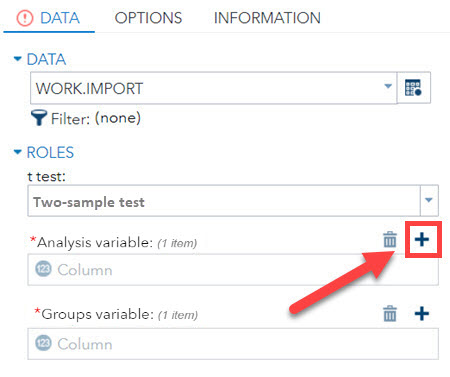
Step 5
Two boxes for Analysis variable and Groups variable will appear. Next to Analysis variable, select the icon. A dialog box will open.
Step 6
Pick which column from your data that you want for the Analysis variable. Select OK.
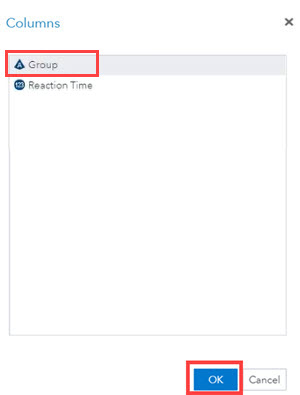
Step 7
Repeat Step 5 and Step 6 for Groups variable.
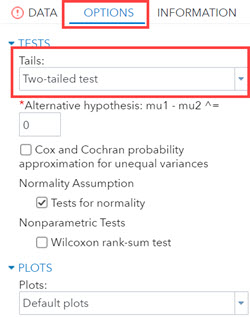
Step 8
Select Options and under Tails, be sure Two-tailed test is selected.
Step 9
You are now ready to run the t-test. Select the icon in the toolbar. A dialog box will open.
Step 10
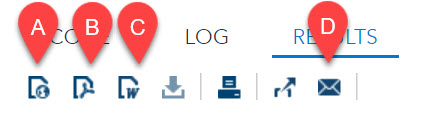
Once you've run the test, your results will appear in the right side of the SAS interface. You can export your results by selecting the following icons:
- HTML File: Use this if you are familiar with HTML files and want to share it with HTML coding.
- PDF File: Use this if you want to share the results in a static document on its own.
- Microsoft Word File: Use this if you want to be able to embed tables, graphs, and other data within a paper. This provides image copies of SAS results.
- Email: Allows you to email the files.
Performing a linear regression with SAS Studio
You must complete the How to Use SAS Studio for RSCH 650 prior to completing the following steps.
Be sure you refer to your course for assignment specific information. The purpose of this area is to help you perform a linear regression using SAS Studio.
Step 1
Be sure you are logged into SAS Studio. If you haven't already, open the Libraries directory and open the WORK folder.
Double-click IMPORT to open your data in the SAS interface.
Step 2
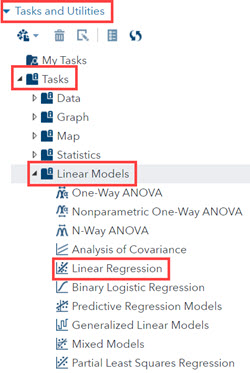
Your data should be open on the right area of the SAS interface. To perform a task, go to the Tasks and Utilities section.
Open Tasks > Linear Models. Double-click Linear Regression to open the statistics task interface.
Step 3
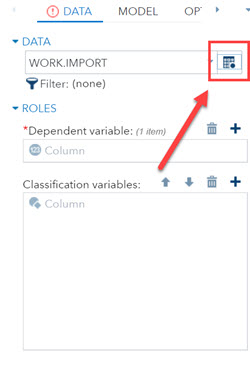
You need to load your data into the linear regression interface. Select the icon to open your SAS libraries.
Step 4
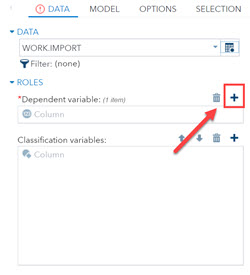
Next to Dependent variable, select the icon. A dialog box will open.
Step 5
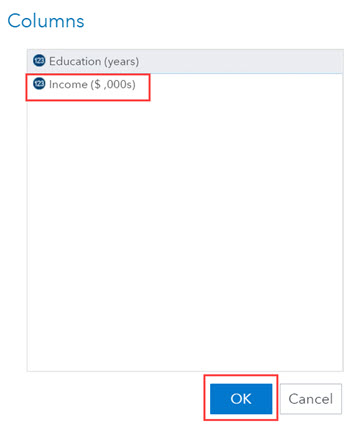
Pick which column from your data that you want for the dependent variable. Select OK.
Step 6
Scroll to Continuous Variables and select the icon. A dialog box will open.
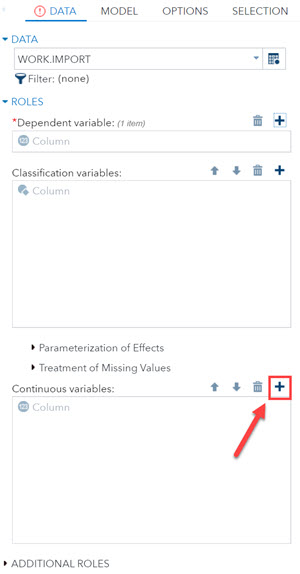
Step 7
Pick which column from your data that you want for the continuous variable. Select OK.

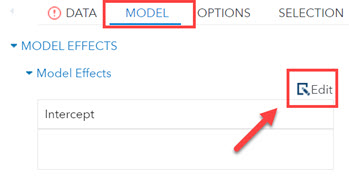
Step 8
Select Model and then select Edit. A dialog box will open.
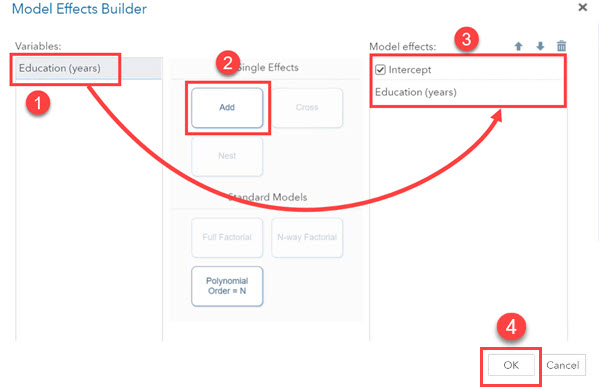
Step 9
Follow the steps below:
- Under variables, select the continuous variable you identified in Step 8.
- Select Add to move the continuous variable to the model effects side of the model builder.
- Verify that your continuous variable is listed under model effects and that Intercept is selected.
- Scroll and select OK.
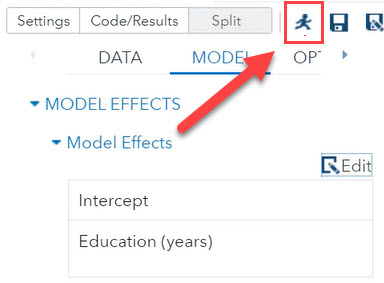
Step 10
You are now ready to run the linear regression. Select the icon in the toolbar. A dialog box will open.
Step 11
Once you've run the test, your results will appear in the right side of the SAS interface. You can export your results by selecting the following icons:
- HTML File: Use this if you are familiar with HTML files and want to share it with HTML coding.
- PDF File: Use this if you want to share the results in a static document on its own.
- Microsoft Word File: Use this if you want to be able to embed tables, graphs, and other data within a paper. This provides image copies of SAS results.
- Email: Allows you to email the files.
Performing a correlation with SAS Studio
You must complete the How to Use SAS Studio for RSCH 650 prior to completing the following steps.
Be sure you refer to your course for assignment specific information. The purpose of this area is to help you perform a correlation using SAS Studio.
Step 1
Be sure you are logged into SAS Studio. If you haven't already, open the Libraries directory and open the WORK folder.
Double-click IMPORT to open your data in the SAS interface.
Step 2
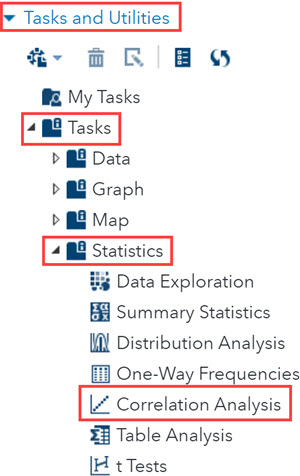
Your data should be open on the right area of the SAS interface. To perform a task, go to the Tasks and Utilities section.
Open Tasks > Statistics. Double-click Correlation Analysis to open the correlation task interface.
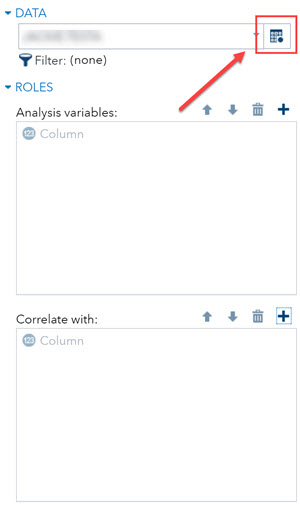
Step 3
You need to load your data into the correlation interface. Select the icon to open your SAS libraries.
Step 4
Next to Analysis variables, select the icon. A dialog box will open.
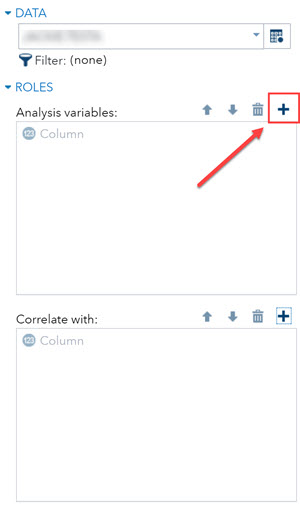
Step 5
Pick which column from your data that you want for the analysis variable. It doesn't matter which variable you choose, the results will be the same. Select OK.
Step 6
Scroll to Correlate with and select the icon. A dialog box will open.
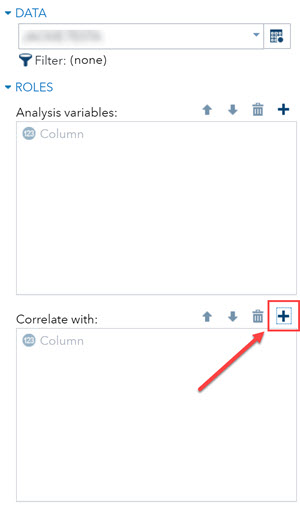
Step 7
Pick which column from your data that you want for the correlate with option. t doesn't matter which variable you choose, the results will be the same. Select OK.
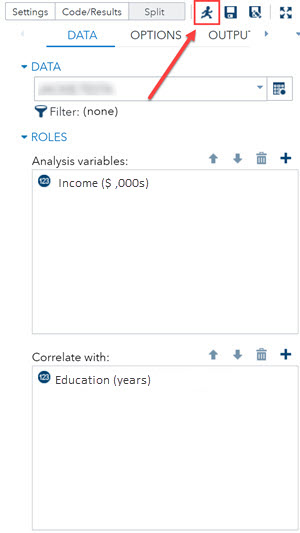
Step 8
You are now ready to run the correlation analysis. Select the icon in the toolbar. A dialog box will open.
Step 9
Once you've run the test, your results will appear in the right side of the SAS interface. You can export your results by selecting the following icons:
- HTML File: Use this if you are familiar with HTML files and want to share it with HTML coding.
- PDF File: Use this if you want to share the results in a static document on its own.
- Microsoft Word File: Use this if you want to be able to embed tables, graphs, and other data within a paper. This provides image copies of SAS results.
- Email: Allows you to email the files.