Using Tableau Desktop
To use Tableau Desktop, you'll need to first start by importing/configuring data. Then you'll be able to display your data in meaningful visualizations that can be used for course work. Select an how-to option in the menu to get started.
There are many advanced features within Tableau Desktop; this section will only cover the basics to get users started.
To learn more about Tableau Desktop's advanced features, check out the Tableau Desktop and Web Authoring Help resources or Tableau for Students FAQs.
Tableau Desktop Interface
The Tableau Desktop interface is robust. You may wish to utilize the resources below to better understand the Tableau environment:
Connect and Configure Data Sources to a Server
Before you create visuals in Tableau Desktop, you'll need to have connected and configured your data. Tableau Desktop allows you to either connect data to a static file or to a server; connecting a data source to a server is detailed below.
When you launch Tableau Desktop, the data connectors that are available to you are listed on the Connect pane, which is the left pane on the Start page. Under Search for Data, select Tableau Server to find data using Tableau Server or Tableau Cloud.
File types are listed next, then common server types, or servers that you've recently connected to.
Click More to see the complete list of data connectors you can use.
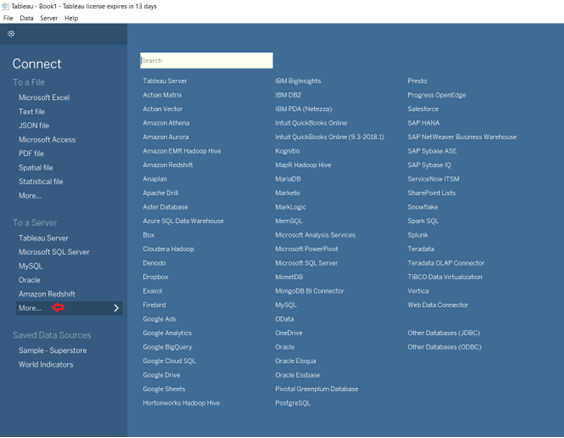
For supported files and databases, Tableau provides native connectors that are built for and optimized for those types of data. If your file or database type is not listed under Connect, use this native connector to connect to your data. If your filed or database type is not listed, you might have the option of creating your own connection using Other Databases (IDBC), Other Databases (ODBC), a Web Data Connector, or a Connector Plugin built using the Tableau Connector SDK. Tableau provides limited support for connections you create using these options.
You supply different information for each data connection that you want to make. For example, for most data connections, you'll need to supply a server name and your sign-in information. With some data connections, you can Run Initial SQL statements, and SSL-enabled servers require that you select the Require SSL check box when you connect.
Read More: Tableau Desktop and Web Authoring Help
Connect and Configure Data Sources to a File
Before you create visuals in Tableau Desktop, you'll need to have connected and configured your data. Tableau Desktop allows you to either connect data to a static file or to a server; connecting a data source to a file is detailed below.
Tableau Desktop allows you to import data in the following file formats:
- Microsoft Excel
- Text
- JSON
- Microsoft Access
- Spatial
- Statistical
This section discusses how to import Excel file types. Visit Tableau Desktop: Supported Connectors for help with different data source types and support for data preparation.
Step 1
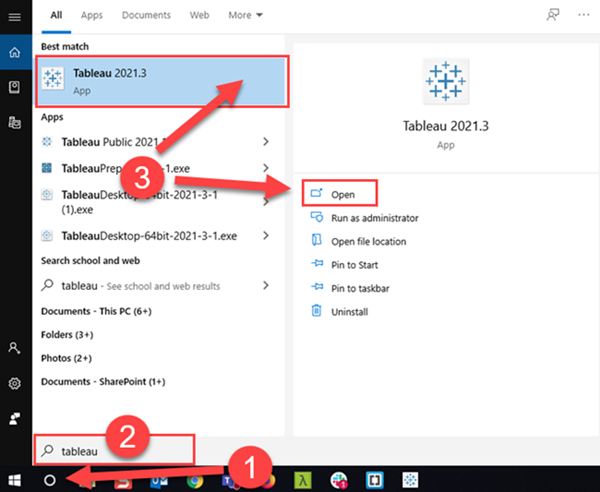
If you haven't already, open the Tableau Desktop app in your Start or Search bar:
- Open the search bar from the Windows toolbar.
- Type Tableau into the search bar.
- Select Tableau or Open.
Step 2
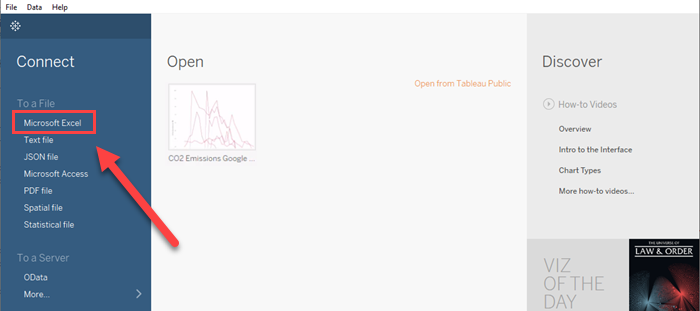
You'll see the application home screen; from this area, you can import data files as well as open saved work books. Select the appropriate file type from the menu. This will open your device's local file explorer.
Step 3
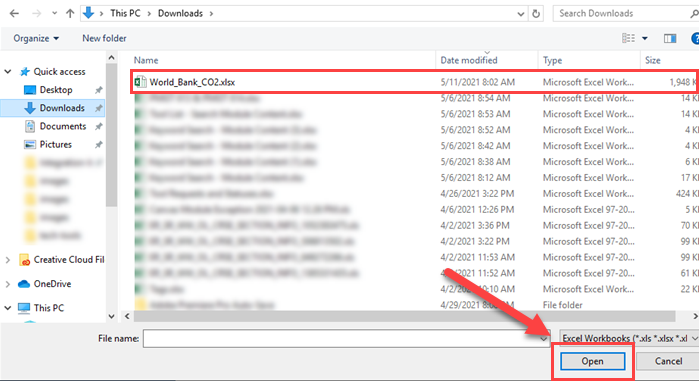
Locate and select the Excel file, and then select Open to import the file.
Step 4
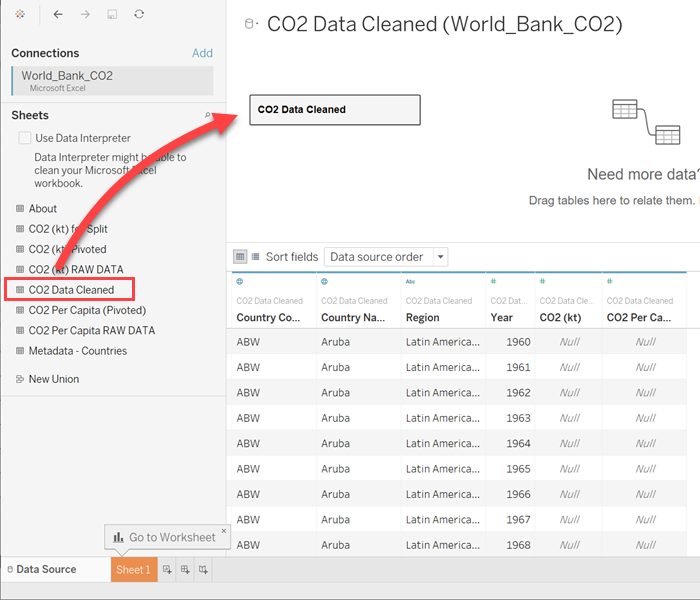
Each sheet from the Microsoft Excel file will appear as an option to manipulate. Drag the sheet to the right to see a preview of the dataset. Drag the option back to the left to remove it from the data map.
Step 5
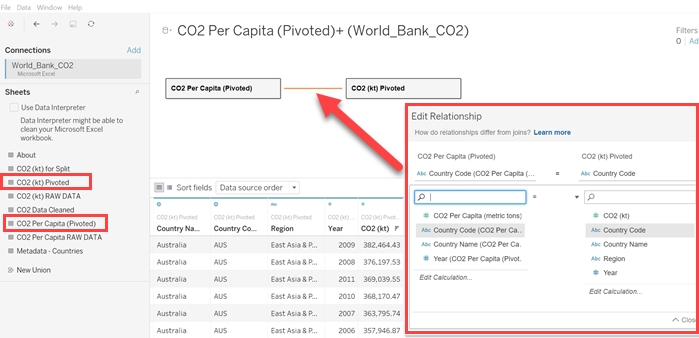
You can combine multiple datasets by establishing their relationship in Tableau. Relationships do not join columns of data together; instead, the data from both sheets is always available.
Once you have one sheet in the data map, you can drag another one into the same area. A line between the two datasets will automatically appear.
You'll be prompted to edit the relationship between the two datasets; Tableau will automatically find related fields, but you can choose your own as well.
Note: Another way to connect datasets includes Joins and Unions. However, Tableau Desktop suggests utilizing relationships instead of joins or unions because they are more dynamic and flexible. You may wish to read more about How Relationships Differ from Joins.
Step 6
Once you've gotten all the datasets configured, you can begin making visualizations. Navigate to the Creating Visualizations area of this page to continue.
Need more support? Visit the Tableau Resources below:
How to Create Data Visualizations in Tableau Desktop
Visualizations, often referred to as 'viz' by Tableau, use visual elements like charts, graphs, and maps to make data easier to interpret. Several visualizations can be combined to make a dashboard.
This guide will discuss the basics of making a chart; visit the Tableau Desktop Documentation page for help with dashboards, stories, etc.
Once you've completed the Connect & Configure Data section of this page, you can begin making your first visualization.
Step 1
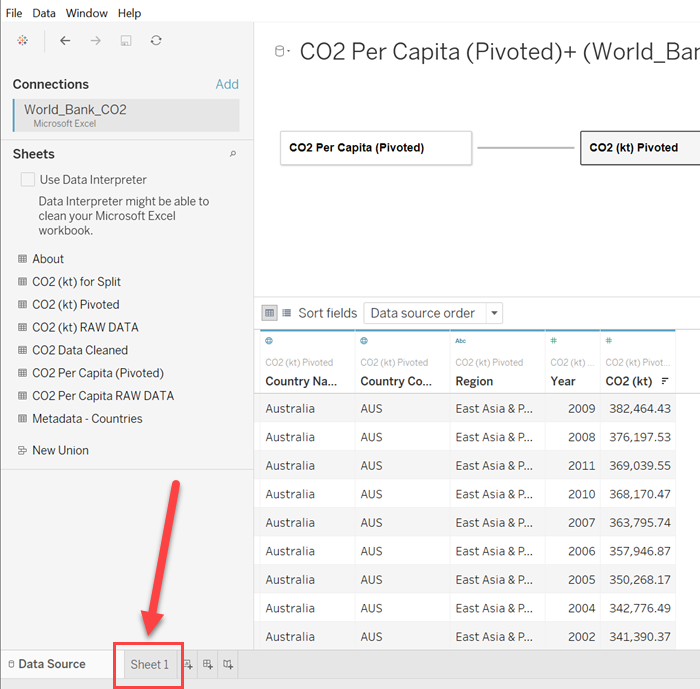
From the same window where you configured the datasource, select Sheet 1. This will open a workspace to begin making your visualization.
Note: You can select the icons to create a new
worksheet  ,
dashboard
,
dashboard  , or story
 .
.
Step 2
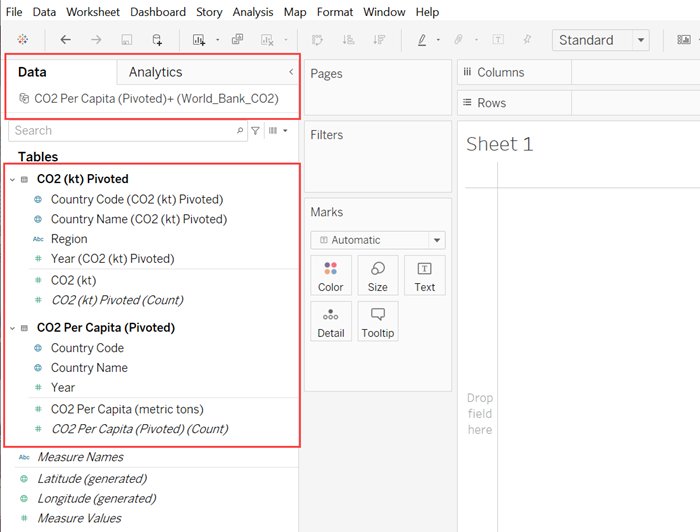
Note that the data includes the two sets you configured in Tableau; you can always revisit the relation under the Data Source. The columns from each dataset are available to add to the visualizations. Tableau will also auto-generate data measures (such as longitude and latitude) based on your data set.
Step 3
Click and drag a data dimension or measure available into the workspace.
Data dimensions or measures can be dropped in the following areas:
- Pages: You can break a view into a series of pages so you can better analyze how a specific field affects the rest of the data in a view. Read more about the Pages shelf.
- Filters: Specify which data to include and exclude. Read more about the Filters shelf.
- Marks: Adjust the visual elements of your visualization, including the color, size, shape, text, and details of a data point. Read more about the Marks card.
- Columns & Rows: Create columns and rows with
specific data measures. Read more about
the Columns and Rows card.
- Note: To generate a map, place Longitude in the Column area and Latitude in the Row area. Then you'll be able to add data points to the map by dragging the measures to the Marks card.
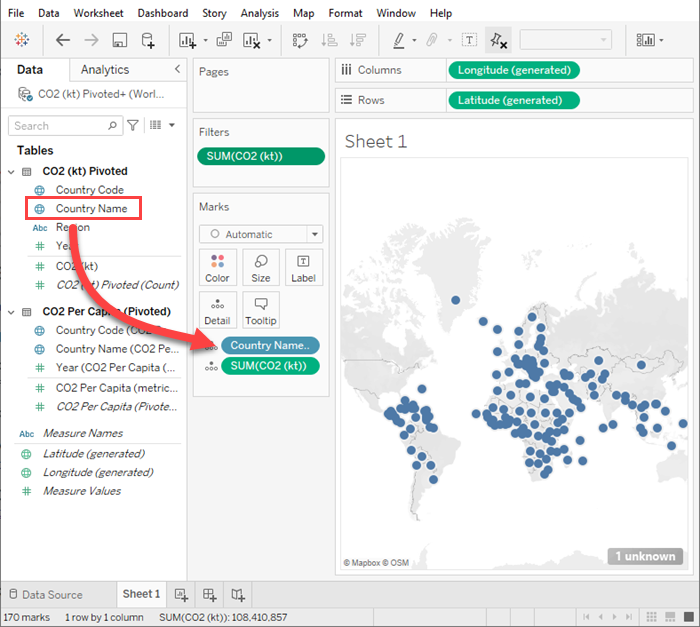
An example of a map visualization. When the user hovers over a mark on the map, it displays the sum of CO2 emissions; the map is filtered to show emissions less than a certain number.
Step 4
Be sure to save your work; Tableau does not automatically save your progress, so save the file frequently to ensure no work is lost.
You may wish to select:
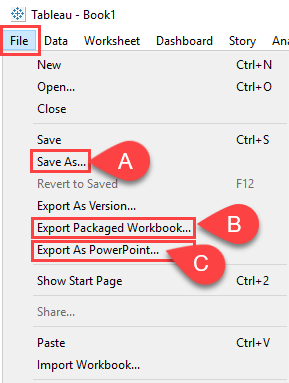
- File > Save As: Saves a Tableau Workbook (.twb) file to the Tableau Repository folder on your device. This is a XML file type that acts as a working file - it includes information about your sheets, dashboards, stories, data sources, etc.
- File > Export Packaged Workbook: Saves a Packaged Tableau Workbook (.twbx) file to the Tableau Repository folder on your device. This file type includes the Tableau workbook as well as any local data sources and images.
- File > Export as PowerPoint: This option converts your Tableau work into Microsoft PowerPoint slides.
Helpful Visualization Guides
Tableau visualizations are highly customizable. You may want to utilize some of the Tableau resources to better understand how you want to display your data:
- Build Charts and Analyze Data: Basic skills to build views, organize and customize your visuals, and develop meaningful analysis.
- Format Your Work: Basics about visual best practices and how to modify the formatting of your visual.
- Create Dashboards: How to compile several views into a meaningful dashboard view.
- Create Stories: Support to help develop data narratives and demonstrate connections among analyses.
Exporting Your Tableau Work
Once you've used Tableau Desktop to create visualizations, dashboards, stories, etc., you may need to submit your work directly in Canvas or use assets from Tableau for your assignments.
There are a few ways you can export your Tableau work for course submission:
- File > Save As: Saves a Tableau Workbook (.twb) file to the Tableau Repository folder on your device. This is a XML file type that acts as a working file - it includes information about your sheets, dashboards, stories, data sources, etc.
- File > Export Packaged Workbook: Saves a Packaged Tableau Workbook (.twbx) file to the Tableau Repository folder on your device. This file type includes the Tableau workbook as well as any local data sources and images.
- File > Export as PowerPoint: This option converts your Tableau work into Microsoft PowerPoint slides.